Alexander Genser
Traffic signal control data set
Traffic signal and loop detector data for ML applications.
Problem description
Full paper: | Implementation: | Download data set:
Fully actuated signal controls are becoming increasingly popular in modern urban environments, attempting to reduce congestion locally, synchronize flows, or prioritize specific types of vehicles. This trend is expected to grow as more vehicles are expected to communicate via Vehicle-to-Infrastructure (V2I) communication. The presented dataset contains cleaned observations from a fully actuated signal control system with priority for public transportation. Time series data of traffic signals that regulate vehicle, public transportation, bicycle, and pedestrian traffic flows are available, showing where a traffic signal operates in a red or green phase. Also, loop detector data representing the occupancy at several locations at an urban intersection in Zurich, Switzerland is available. The data of all traffic signals and loop detectors corresponds to January and February 2019 and has a resolution of 1 second. Recent advances in transportation science show novel approaches for signalized intersections, but most publications assess their methodology on self-collected or simulated data. Therefore, the presented dataset aims at facilitating the development, calibration, and validation of novel methodological developments for modeling, estimation, forecasting, and other tasks in traffic engineering. Furthermore, it can be used as a real-world benchmark dataset for objectively comparing different methodologies.
Contributions
- Due to the scarcity of high-resolution traffic signal and loop detector data from an actuated traffic signal control, this dataset is significant to support the design of methodologies capturing non-linear spatial-temporal traffic relationships.
- Researchers and data scientists can benefit from the dataset when developing and testing estimation and prediction models, e.g., traffic flow, travel times, or signal phase timings.
- The dataset can also be useful for benchmarking to allow for a comparative analysis of various data-driven methodologies at urban intersections.
Data description
The dataset consists of four comma-separated-value (CSV) files with 15 days of consecutive time series data each. The corresponding names are ‘intersection_data_set_jan_01_15.csv’, intersection_data_set_jan_16_30.csv’, intersection_data_set_feb_01_15.csv’, and ‘intersection_data_set_feb_16_28.csv’. Note that the second dataset for February only contains 12 days. In total, two months of data are available for January and February 2019. The data includes the device states for all traffic lights and loop detectors (LD) at an urban intersection. Every data sample (a row entry in the dataset) corresponds to one observation. The provided data resolution is 1 sec. Each CSV file provides the same data structure defined as follows:
- Time: Time of the recorded sample containing year, month, day, and timestamp in the format YYYY-MM-DD HH:MM:SS.
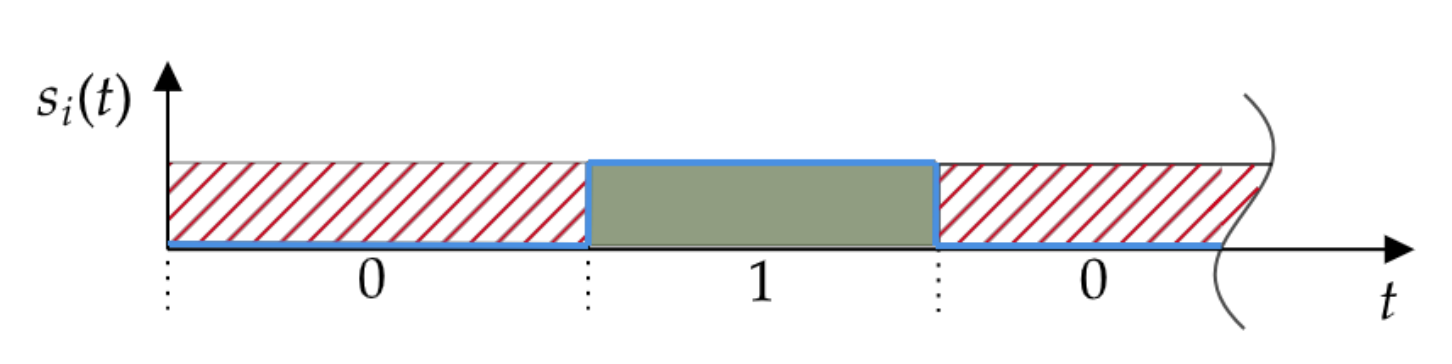
- sg1 – sg12: Time series of traffic signals 1 to 12 with corresponding states 0 or 1.
- d1 – d10: Time series of LDs 1 to 10 with corresponding states 0 or 1.
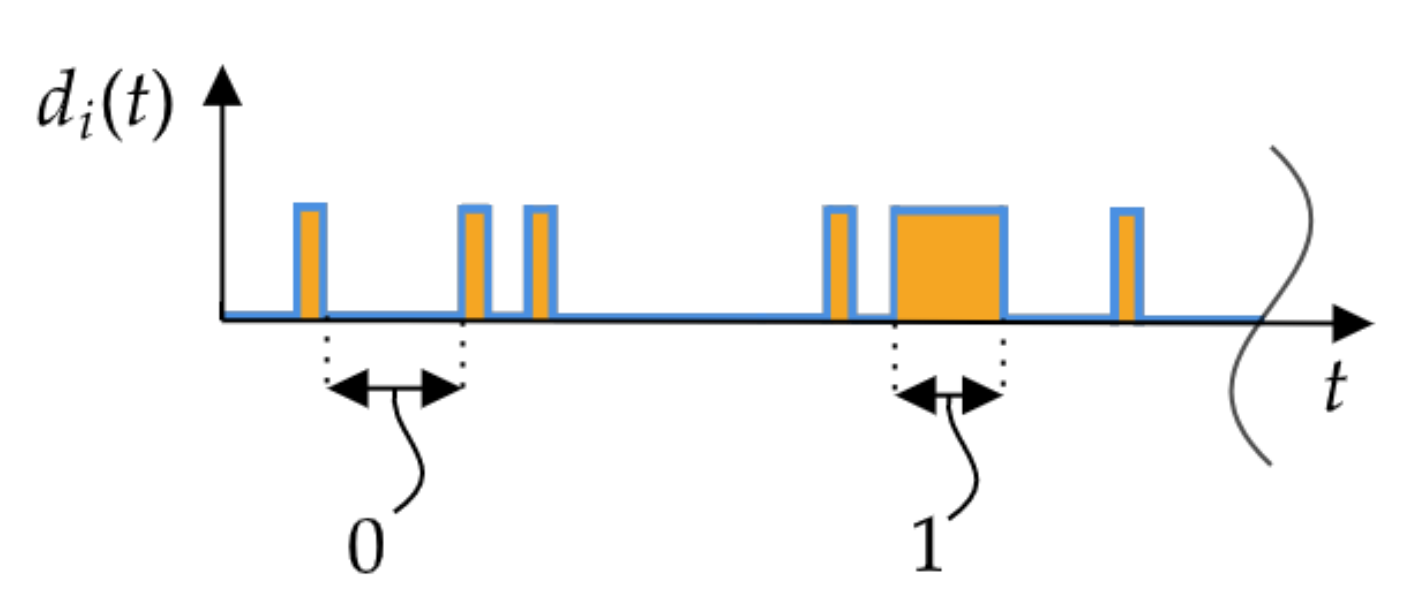
All LDs in the dataset are also provided as time series with the states 0 and 1. The state 0 represents an LD not occupied, i.e., no vehicle currently passes the location where the LD is implemented. On the other hand, if an LD shows a pulse, meaning that the signal state is 1, a vehicle occupies the LD. Figure 2 depicts a sample signal of an LD with six detections and the corresponding signal states.
Experimental set-up
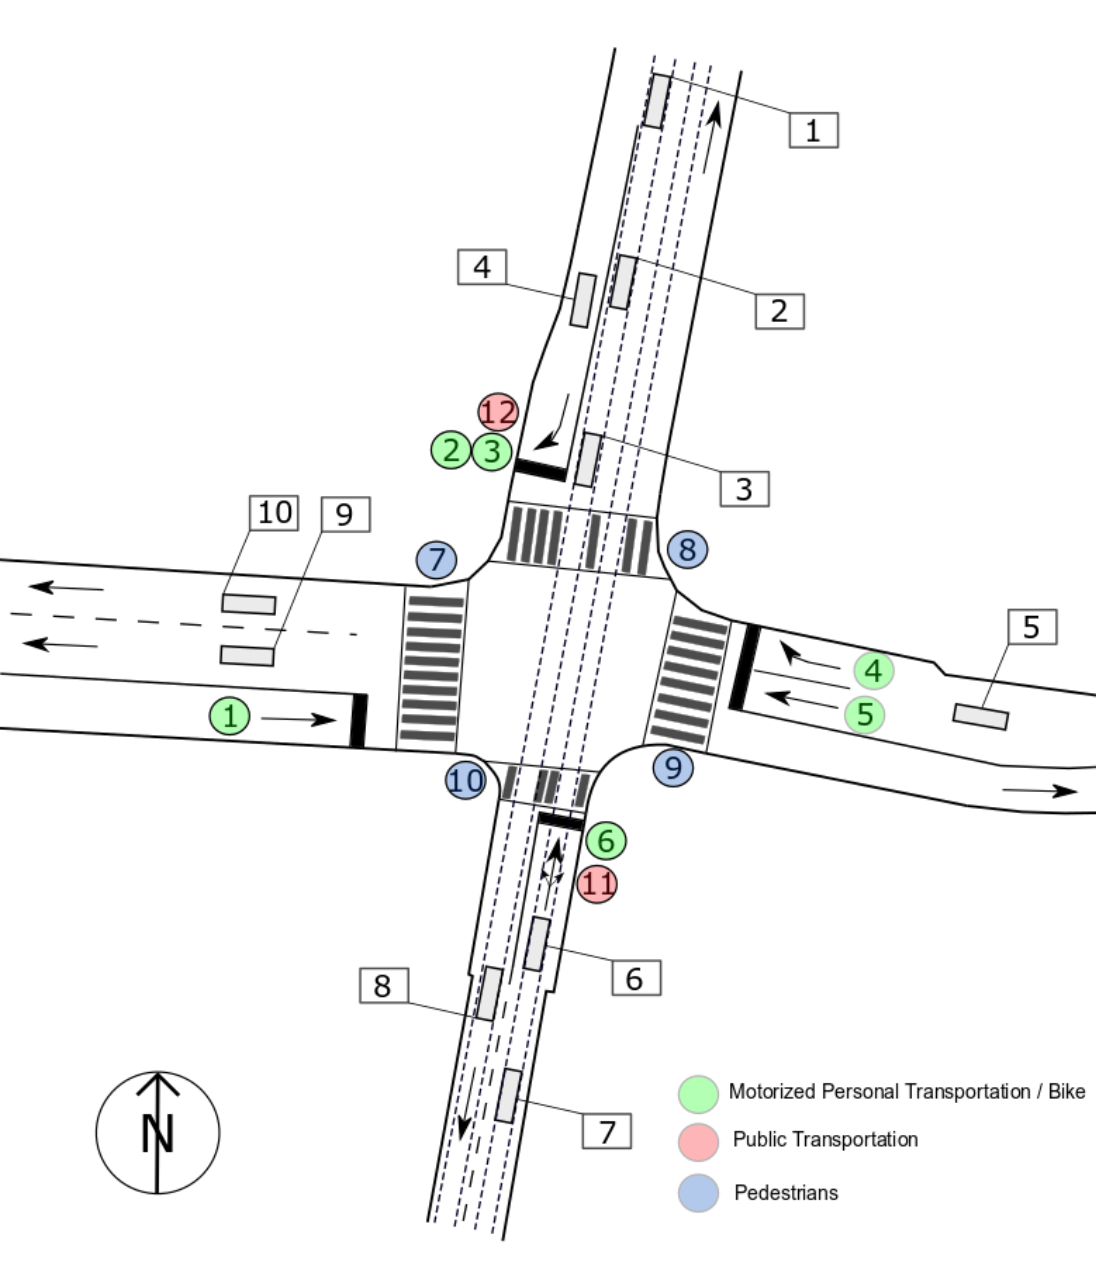
The collected dataset represents traffic signal and LD data from a four-leg intersection in Zurich, Switzerland. The intersection, depicted in Figure 3, is regulated by a fully-actuated signal control system, meaning that red, green, and cycle times are non-constant [2,3]. The variation of these is due to the priority of public transportation and the extension or shortage of signal phases based on the intersection approach’s traffic demand [4]. The speed limit for the intersection’s northbound and southbound approach is 30 km/h. For approaches from west and east, the maximum speed is regulated at 50 km/h. In Figure 3, the traffic signals are shown with circled numbers. There are 12 traffic signals installed at the stop lines. Signals 1, 2, 4, 5, and 6 control vehicular traffic streams and follow a red-green signalization pattern. Traffic signal 3 regulates only bicycle flows that can travel straight to the south. Pedestrian flows are regulated by signals 7 - 10. From north to south and vice versa, multiple tram lines frequently operate between 7:00 and 22:00. The tram tracks are indicated by dashed lines and overlap with car lanes for the southbound approach. The signal control potentially prioritizes public transportation, and signals 11 and 12 represent the designated traffic lights for trams. This subset of traffic lights only operates in a green phase when trams arrive at the intersection.
The city of Zurich operates the signal control system of the intersection. A centralized system provides log files of the control system that contain event-based telegrams (i.e., records). Every telegram contains the time of the event, an identifier of the control system, the device identifier that triggered the event, and the new device state. For example, if traffic signal 1 changes from a red phase to a green phase, the telegram would contain a device-id of ‘sg1’ and the new state of 1. The log files contain every new event as a one-line string entry. For the compilation of the presented dataset, regular expressions are designed to automatically extract the timestamps, device identifiers, and the corresponding state. The telegrams are event- based, i.e., only when a device changes its state a telegram is sent. Therefore, the time axis is unevenly spaced. We construct a consecutive time axis (resolution of 1 sec) and impute the tracked states so that the dataset provides an evenly spaced time series. The procedure is applied for all available log files and all available devices implemented at the intersection.
In the following, details about the location and traffic flows regulated by traffic lights 1 to 12 are presented. For all available traffic lights, Table 1 represents the location, the controlled transport mode, and the traffic flow characteristics (direction of traffic arrival and departure for all traffic signals, respectively).
| Device | Location | Transport modes | Direction of arrival | Direction of departure |
|---|---|---|---|---|
| Sg1 | Stop line | MPT, Bike | West | East |
| Sg2 | MPT, Bike | North | West | |
| Sg3 | Bike | North | South | |
| Sg4 | MPT, Bike | East | West | |
| Sg5 | MPT, Bike | East | North | |
| Sg6 | MPT, Bike | South | West/North/East | |
| Sg7 | Pedestrians | North/South | North/South | |
| Sg8 | Pedestrians | West/East | West/East | |
| Sg9 | Pedestrians | North/South | North/South | |
| Sg10 | Pedestrians | West/East | West/East | |
| Sg11 | PT | South | North | |
| Sg12 | PT | North | South |
For the LDs available in the dataset, Table 2 lists the device name, the location, the detected transport modes, and the traffic light that regulates the detected traffic stream. Note that the location is measured (a) from the stop line if a detector is implemented upstream of a traffic light, and (b) from the pedestrian crossing if implemented downstream. No separate detector data is implemented for traffic signals 1, 3, and 7-9. Hence, no information on arriving vehicles, cyclists, or pedestrians is available.
| Device | Location | Detected modes | Traffic light |
|---|---|---|---|
| D1 | 220m (upstream) | PT | sg12 |
| D2 | 50m (upstream) | PT | sg12 |
| D3 | 1m (upstream) | PT | sg12 |
| D4 | 18m (upstream) | MPT, Bike | sg2, sg3 |
| D5 | 43m (upstream) | MPT, Bike | sg4, sg5 |
| D6 | 2m (upstream) | MPT, PT, Bike | sg6, sg11 |
| D7 | 15m (upstream) | MPT, PT, Bike | sg6, sg11 |
| D8 | 50m (downstream) | MPT, PT, Bike | - |
| D9 | 10m (downstream) | MPT, Bike | - |
| D10 | 10m (downstream) | MPT, Bike | - |
If you are intersted in an ML application with the presented data set, check out the project about Signal phase timing predictions.
References
[1] T. Riedel, M. Menendez, “7 – Switzerland,“ Global Practices on Road Traffic Signal Control, 2019, pp. 99-115, doi: 10.1016/B978-0-12-815302-4.00007-8.
[2] LX. Zheng, W. Recker, “An adaptive control algorithm for traffic-actuated signals,” Transportation Research Part C: Emerging Technologies, Volume 30, 2013, pp. 93-115, doi: 10.1016/j.trc.2013.02.007.
[3] S. Lämmer, D. Helbing, “Self-control of traffic lights and vehicle flows in urban road networks,” Journal of Statistical Mechanics: Theory and Experiment, Volume 4, 2008, P04019, doi: 10.1088/1742-5468/2008/04/p04019.
[4] JW. Eikeila, T. Sayed, M. E. Esawey, “Development of Dynamic Transit Signal Priority Strategy,” Transportation Research Record, Volume 2111, pp. 1-9, doi: doi.org/10.3141/2111- 01.